From Beijing to Brussels: What Supply Chain ‘Resilience’ Means for the Rest of the World
If the pandemic made supply chains a dinner-table topic, the last few years have turned them into a strategic priority. On both sides of the Atlantic, the core question is the same: how do you make supply chains more secure without breaking the very efficiency and flexibility that made them attractive in the first place?
The answers, however, may look very different. The United States is racing ahead with large subsidies, tax credits, and friend-shoring policies; Europe is tightening its regulatory approach, building resilience into standards, disclosure rules, and market-access conditions. In other words, while Washington, D.C., has generally reached for carrots, Brussels reaches for the rulebook. Both are discovering that resilience comes with a price tag. In practice, they are responding to the same underlying pressures: China’s growing dominance in logistics and manufacturing, and a more volatile geopolitical and climate landscape that has resulted in supply chains becoming a national security concern. That raises two questions this piece takes up in turn: what drives supply chain resilience, and how do smaller economies plug into this new global order?
These themes were at the heart of the Global Resilient Supply Chains Roundtable hosted by the Baratta Center for Global Business Education at Georgetown McDonough. Delegates across the world — from Albania, Angola, and the Maldives to Japan, Spain, and the UK — discussed three big questions:
- How should “supply chain resilience” be defined and measured?
- What’s behind the “de-risking” and “decoupling” policies of the U.S. and EU today?
- Where do smaller economies fit into this re-wiring of global production?
What Do We Mean by “Resilient” Supply Chains?
In simple terms, supply chain resilience is the ability of a trade and logistics system to absorb shocks, adapt, and keep goods moving in a timely and affordable way.
In practice, resilience cannot easily be captured by a single number. It’s a combination of things such as how long it takes and how much it costs to ship goods, how diversified suppliers and trade routes are, how congested ports are, how efficient customs and border procedures are, and how vulnerable key routes are to geopolitical or climate-related disruptions.
One widely-used headline measure of resilience is the Global Supply Chain Pressure Index (GSCPI) created by the Federal Reserve Bank of New York. It aggregates data on shipping costs, delivery times, order backlogs, and freight rates into a standardized index where zero represents “normal” pressure, while positive values indicate above-average strain (and negative ones represent below-average pressure).
Figure 1: The Global Supply Chain Pressure Index (GSCPI) over the years.
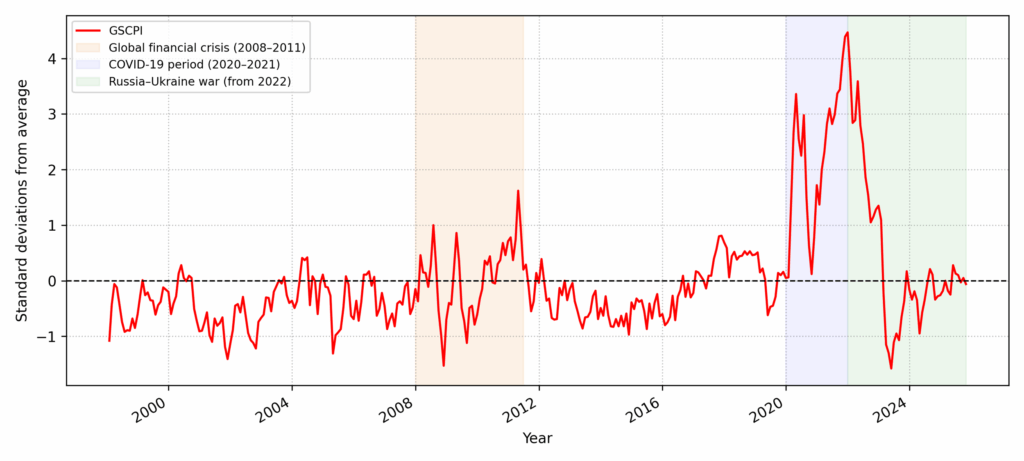
Source: The Federal Reserve Bank of New York. This index aggregates data on shipping costs, delivery times, order backlogs, and freight rates into a standardized index where zero represents “normal” pressure, while positive values indicate above-average strain (negative ones represent below-average pressure).
As can be seen in Figure 1, the COVID-19 period between 2020-22 saw the most significant spike in supply chain pressure experienced over the last two decades — driven by restrictions on movement of people and goods as well as the excess demand of medical supplies across the world. Figure 1 also indicates episodic spikes in the global supply-chain strain index in the years following the 2008 financial crisis. In contrast, Russia’s invasion of Ukraine in 2022 appears to have had no significant effect on the index: it declined continuously over the months.
At first glance, this is counterintuitive. The invasion clearly disrupted energy, food, and input markets, yet it did not register as a renewed surge in the GSCPI. A possible reading would suggest that the war’s effects were concentrated in specific commodities and regions, while the index is designed to pick up broad-based, logistics-heavy stress: shipping costs and delivery delays. Two mechanisms can explain why the index remained muted even as macroeconomic pressures intensified.
One explanation could be methodological: the GSCPI is built from global freight rates (for containers, bulk shipping, and air cargo) and manufacturing survey indicators, such as delivery times, order backlogs, and inventories for seven large economies. Sharp, commodity-specific disruptions in food, fertilizer, and pipeline-based gas flows from Russia and Ukraine can therefore show up more as regional energy and food-price shocks (and have a limited impact on the index) than as a generalized surge in global shipping costs or factory delivery delays.The second explanation is that the system may genuinely have become more resilient to this kind of shock. Since 2022, Western governments have moved proactively to “de-risk, not decouple” supply chains, diversifying away from Russian fossil fuels, accelerating investment in LNG infrastructure and renewables, and tightening coordination among allies. Studies of post-Ukraine trade patterns find that Russia has been the main target of decoupling efforts, while Europe and its partners have re-routed energy and other strategic imports rather than allowing disruptions to cascade through global container trade. On this reading, the steady decline of the GSCPI during the war is less a sign that nothing broke, and more evidence that deliberate de-risking limited the war’s ability to trigger COVID-19-style global bottlenecks.
Either way, one lesson is clear: aggregate global indices don’t always match lived experience, especially for smaller economies that may feel price and supply shocks more sharply. This is where more granular data can help.
Models of Resilience: The U.S., Europe, and China
A second thread from the roundtable was the contrast between American, European, and Chinese roles in the emerging “resilience game.”
In recent decades, Europe and the U.S. are trying to re-engineer supply security at the margin — through incentives in Washington, D.C., and regulatory leverage in Brussels — responding, in large part, to the growing economic clout of China. To understand why “de-risking” is politically urgent, yet economically hard, it helps to start with the scale and intentionality of China’s investment-led rise.
Over the last three decades, China has poured extraordinary resources into its trade infrastructure: between 2002 and 2016, infrastructure investment rose from about 8% to 24% of GDP, which is around five times the average for other low- and middle-income economies at the time. It has also bet heavily on building and controlling a global network of ports and corridors, most visibly through President Xi Jinping’s Belt and Road Initiative, under which more than a trillion dollars has flowed into port, rail, and logistics projects on every continent except Antarctica. The result is what we see today: a country that has raised its share of global manufacturing from under 5% to around 30%, become a dominant exporter of intermediate goods, built world-class ports and logistics hubs, and taken lead positions in electronics, clean-tech equipment, and critical-minerals processing.
What kind of data do we have to visualize the changing dynamics of trade and resilience across countries over the years? In the absence of a single definitive measure of ‘resilience,’ we must look elsewhere for proxies.
Logistics infrastructure (especially ports, hinterland road/rail links, and customs facilities) is where global supply chains either absorb shocks or amplify them into costly bottlenecks. Evidence from recent IMF work on pandemic-era port congestion shows that longer ship waiting times and overloaded terminals directly increased trade frictions and delayed deliveries, underscoring how constrained port capacity can destabilize entire supply networks. OECD analysis likewise treats ports and airports as “critical infrastructure,” warning that disruptions at these gateways can propagate quickly through international production networks unless there is targeted investment in resilient transport systems. Studies on port and transport-infrastructure resilience further document how damage or downtime at key hubs can cut firms off from markets, raise logistics costs, and slow economic recovery after shocks.
The World Bank’s Logistics Performance Index (LPI) is widely used as a proxy for supply chain resilience: it benchmarks countries on a one to five scale across customs efficiency, quality of trade and transport infrastructure (including ports), ease of arranging shipments, tracking and tracing, and the timeliness with which goods reach their destination. The U.S., Europe, and China all score relatively well, but with different profiles.
Figure 2: The Logistics Performance Index (LPI), 2007 and 2023, for the US, China and the EU.
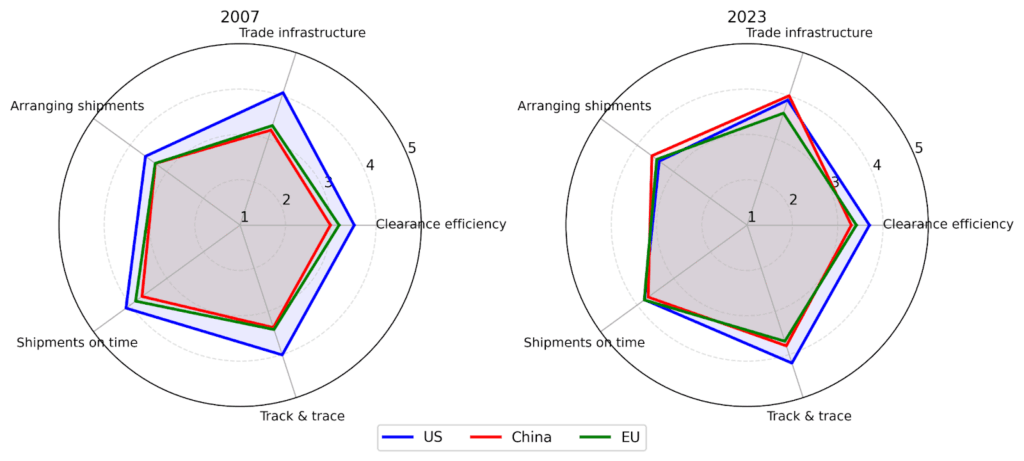
Source: The World Bank. This index benchmarks countries on a one to five scale across customs efficiency, quality of trade, and transport infrastructure (including ports), ease of arranging shipments, tracking and tracing, and the timeliness with which goods reach their destination. China appears to have edged out the U.S. on two of the fine sub-measures by 2023. [Note: The values for the EU reflect the simple average of all the EU countries.]
In 2007, the U.S. clearly led the world on this front: everything from timely shipments to trade infrastructure, it did better than both the EU and China. In the next 15 years, however, China made spectacular progress. On infrastructure and arrangement of shipments today, it fares even better than the U.S. which continues to have an edge in the rest of the categories.
China’s superior ports and logistics network, which now underpin a huge share of global maritime trade and include growing control or influence over key overseas terminals, has turned what used to be an efficiency advantage into a perceived strategic vulnerability for the U.S. and EU. In Washington, D.C., this has fed directly into a wave of “de-risking” policies: the CHIPS Act and related industrial measures are explicitly framed as tools to rebuild domestic capacity in semiconductors and other strategic sectors and to reduce choke-point exposure to Chinese-centered supply chains, alongside friend-shoring initiatives that try to redirect production to trusted partners. Brussels has adopted a similar logic under the banner of “de-risk, not decouple,” with the Critical Raw Materials Act and a wider economic security agenda designed to cut excessive dependence on China for critical inputs by diversifying suppliers, building EU processing capacity, and monitoring supply-chain stress.
Both U.S. and EU “de-risking” strategies are, therefore in practice, efforts to trim reliance on a system that still runs heavily through China — without fully abandoning the world’s most competitive large-scale manufacturing platform.
Supply Chain Resilience in the Smaller Countries Context
What about the rest of the world? Is it worthwhile for the — already resource-constrained — smaller economies of the world to invest in domestic trade and supply-chain resilience (SCR), given their limited geo-political and geo-economic clout? The answer is yes.
Economic growth and SCR are linked in ways that are now well documented in the logistics literature. Investing in trade infrastructure and logistics related to supply chain resilience can earn countries a strong dividend. For instance, the World Bank’s Connecting to Compete series shows that countries with higher LPI scores — capturing customs efficiency, infrastructure, shipment arrangements, tracking, and timeliness — trade more and grow faster than peers at similar income levels because better logistics lower trade costs and support export diversification and global value chain participation.
Recent literature on this argues that logistics quality is not just a by-product of development but a “core determinant” of firms’ competitiveness and countries’ ability to integrate into global markets. In fact, it has been documented that better ‘trade facilitation measures’ lower trade barriers at a faster rate in lower- and lower-middle income countries than in their higher-income counterparts — indicating the strong gains to be had for the smaller, landlocked nations from investing in SCR. At the same time, the OECD Supply Chain Resilience Review shows that trying to build resilience by aggressively relocalizing supply chains — through tariffs, domestic subsidies, and sourcing restrictions — would cut global trade by more than 18% and reduce global real GDP by over 5%, without consistently lowering volatility: implying that open, diversified networks with robust logistics are more growth-friendly than inward-looking “local-only” models. The key message from this is an unambiguous one: it pays to take supply chain resilience and integration seriously.
Figure 3: Correlation between GDP growth and LPI change, 2007-2023.
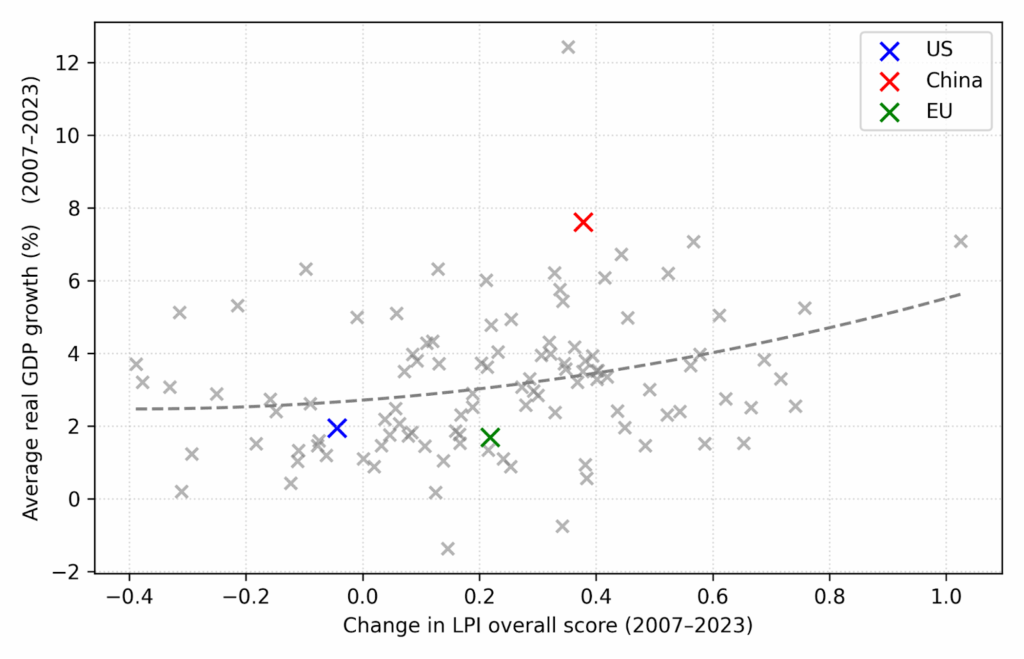
Source: The GDP growth data is taken from the IMF, while the LPI scores are obtained from the World Bank. The average of the (real) GDP growth rate between 2007 and 2023 is plotted against change in the LPI overall index score between 2007 and 2023. While some countries such as the U.S. have seen an overall decrease in their LPI scores, others such as China have seen a strong increase (correlated with their economic performance in this same period). Overall, the two are positively correlated. [Note: Only 107 countries are accounted for here, which are the ones for which data on both GDP growth and LPI scores was available between 2007 and 2023.]
What does this mean for small, emerging, and especially landlocked economies? Landlocked developing countries face systematically higher transport and logistics costs, longer and more uncertain transit times, and greater supply chain unreliability,which tend to depress trade volumes and GDP growth relative to coastal peers. UN-OHRLLS and World Bank follow-up work shows that landlocked developing countries (LLDCs) spend nearly twice as much of their export earnings on transport and insurance as the global average, and incur substantially higher overall trade transaction costs, reflecting dependence on other countries’ ports and corridors and on often cumbersome border procedures. In a context where advanced economies are “de-risking” by privileging suppliers with strong logistics and institutional performance, the risk is that these countries are left at the edge of resilient supply networks, unless they act with the kind of urgency China showed two decades back.
Several levers are available for this set of countries. Policies focused on making transit and port-access easier can bear significant dividends. East African LLDCs such as Rwanda and Uganda have made a strong start by simplifying border procedures and jointly managing access to ports by investing in the Northern Corridor, a multimodal trade route in Africa that has reduced transit times by over two-thirds. Elsewhere, some landlocked states in Central Asia are trying to turn “landlocked” into “land-linked” by branding themselves as transit and logistics hubs along new Eurasian routes like the Middle Corridor, investing in border logistics parks and rail links, so that they earn fees and spillovers from traffic that has to cross their territory anyway. And rather than compete directly with coastal manufacturing giants, LLDC strategies increasingly emphasise diversifying into niches where distance to sea matters less, while treating indicators such as the LPI and resilience indices as explicit policy targets and investor signals.
Framed this way, resilience policy for LLDCs is not only about “catching up” on infrastructure, but about using pathways, institutions, and smart specialization to stay inside the new map of resilient supply chains.
By Akash Chowdhury (G’29)
Research Assistant at the Baratta Center for Global Business Education